
We all know it – blogging is a lot of fun. And the common quote, “It’s all about the journey, not the destination,” can’t be truer when running a blog. From buying a domain name, choosing a blog theme for it, buying hosting, coming up with content ideas, then writing articles, and later promoting them, you are set on an adventurous journey with no clear destination.
And after spending so much time on writing and promoting the blog posts, it’s normal that you should ask yourself: Are users reading my content? If yes, do they like it? Or which traffic source refers to the highest quality visitors that like reading my content? Or which of my guest author writes the most suited content for my blog’s audience?
Unfortunately, you can’t get answers to these questions with the default Google Analytics tracking. So, in most cases, you need to add some custom tracking to your blog to get this information. And it’s a real pity that after putting so much effort into creating the content for your blog, you are left only with some basic metrics like page views, time on page or exit rate. Although important, do not provide all the answers that a blogger has about his content and audience.
That is why in this article we’ll explore 4 custom Google Analytics tracking you can install on your blog which will provide better answers to your questions, which in turn will allow you to focus on the content your visitors like and stop investing in content that does not resonate with your audience.
1. Track how much users scroll on a page
When a user likes what he reads, usually he’ll scrolls until the bottom of that article, so the percentage of page scrolled is a good indicator if visitors like (or dislike) an article. Installing scroll tracking is really easy with Google Tag Manager as it has a built-in scroll trigger that can be used for firing a scroll event tag, which sends data to Google Analytics.
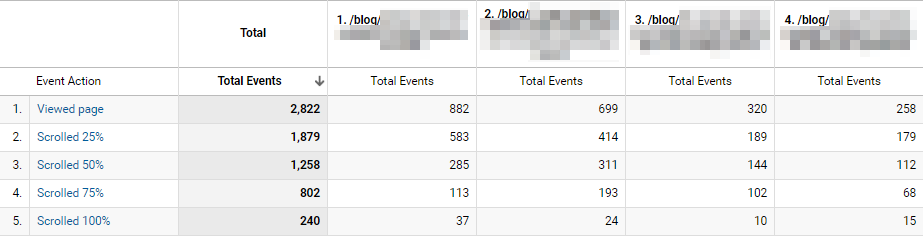
After installing this tracking, you should be able to see how much users scroll on a particular blog post, which in turn can be used as an indicator of what your audience likes to read and what it doesn’t.
2. Track comment submission
Similarly to scroll behavior, when a user is really engaged with the content, he might leave a comment on the page, so tracking this behavior is also a good way of measuring content engagement.
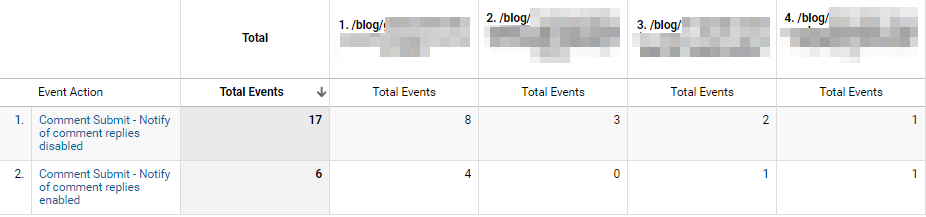
With this information in hand, you can see what topic generates most comments from your audience and write more articles on that subject.
Unfortunately, installing this type of tracking is not as easy as with scroll tracking, so you might have to hire a Google Analytics expert for this, but the effort should really pay off since besides using this as content engagement metric, you can also use it to create remarketing audiences in Google Ads. Later you can create various types of remarketing campaigns where you target these specific users with your customized advertising message.
3. Collect post author and category
If you have multiple authors posting on your blog, it might be wise to track the post author and category as it will provide valuable information for your business. With it, you will be able to tell which are your top and worse performing authors and later provide feedback to them. This is especially important if you publish guest posts on your blog as it will clearly show which authors are suitable for your blog’s audience and which aren’t.
Depending on the URL structure of your blog and how Google Analytics is configured, you can track the post category using content grouping, although this is not always possible (you may audit your Google Analytics if not sure).
For post author tracking, like it is the case with comment tracking, there is no easy way of installing this, so you might want to contact an expert to help you with it.
4. Track clicks on social share buttons from the post
Measuring clicks on the social share buttons is yet another indirect way of telling which article or topic suits your audience and which doesn’t. A lot of social share plugins offer this type of tracking by default so to enable this tracking, you might want to check the documentation of your particular share button provider.
Conclusion
After installing all of these trackings, you will be able to see this information in the “Top Events” reports from Google Analytics or by creating a custom report. And if you want to take the reporting to the next level, you can create a content dashboard in Google Data Studio (since it integrated natively with Google Analytics) and view this data without the noise of the other Google Analytics metrics, which, for some users might be distracting. You can also use QR code to track your blog’s content. You can read more in the How To Track Your QR Codes in Google Analytics article.


best Article Ever